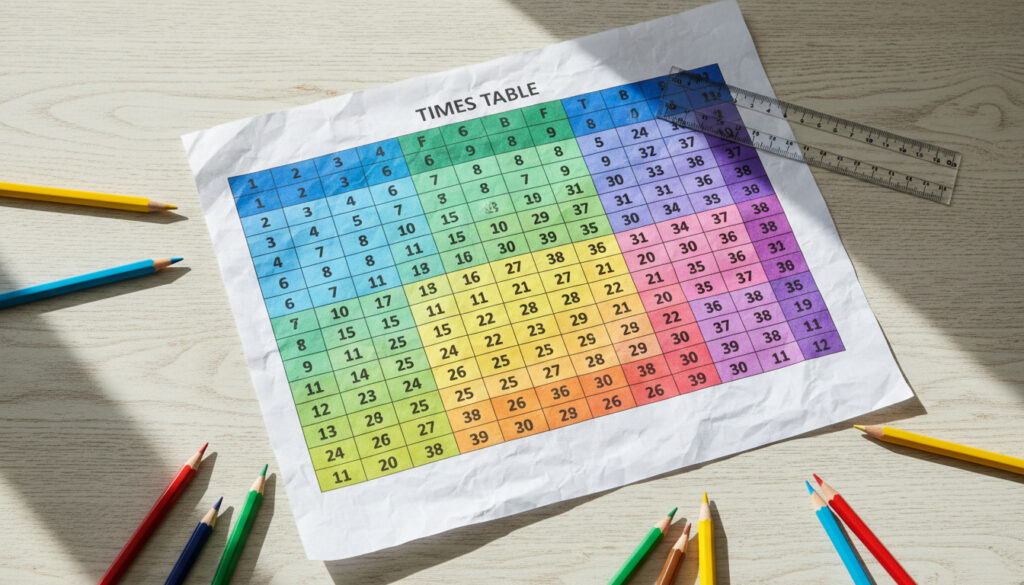
Times Table Chart – Free Printable 1-12 Guide
Times table charts remain essential tools for building arithmetic fluency in primary education. These visual grids display multiplication facts from 1×1 through 12×12, offering students a reference that reduces cognitive load while revealing mathematical patterns. Modern educators utilize both physical posters and digital formats to support learners aged seven to ten, aligning with curriculum standards across North America and the United Kingdom.
Free PDF resources dominate the current landscape, providing immediate access to colorful classroom aids and black-and-white practice sheets. Parents and teachers select from customizable templates, blank worksheets for assessment, and extended ranges up to 20×20 depending on student readiness.
This guide examines the structure, application, and customization of multiplication charts, drawing from educational authorities and downloadable materials verified for classroom use.
What Is a Times Table Chart?
Definition
Visual grid displaying multiplication facts from 1×1 to 12×12, with row and column headers indicating factors.
Key Features
Color-coded rows and columns enable rapid scanning; diagonal lines often highlight perfect squares.
Common Sizes
Standard A4 or US Letter dimensions for desktop references; larger poster sizes for wall mounting.
Primary Benefits
Builds computational fluency and reduces mental calculation time through visual pattern recognition.
- Charts accelerate memorization by exposing visual patterns rather than isolated facts
- Diagonal symmetry reduces the memorization load by demonstrating commutative properties
- Color coding significantly aids visual learners in tracking row and column intersections
- Regular reference builds automaticity faster than isolated oral drills
- Grid format reveals relationships between operations, supporting later algebraic thinking
- Portable sizes enable flexible placement on desks, walls, or in binders
| Attribute | Specification |
|---|---|
| Standard Range | 1-12 (products to 144) |
| Grid Format | 13×13 cells including header row and column |
| File Types | PDF, PNG, SVG for print and digital use |
| Target Age | 7-10 years (grades 2-4) |
| Dimensions | A4 or US Letter standard; poster sizes available |
| Practice Versions | Blank grids available for handwriting practice |
| Visual Options | Full spectrum color or grayscale |
| Extended Ranges | 1-10, 1-15, and 1-20 variants available |
| Diagonal Property | Square numbers run from top-left to bottom-right |
| Curriculum Alignment | Standard in US, UK, and Canadian primary mathematics |
How to Read and Use a Times Table Chart
Reading the Grid Structure
Locate the intersection of row and column headers to find products. For the equation 3×4, find row 3 and column 4; the cell where they meet displays 12. This positional logic applies whether reading left-to-right across rows or top-to-bottom through columns. Suncatcher Studio provides designs with diagonal highlights that help learners track perfect squares and doubling patterns.
Daily Integration Methods
Effective use requires consistent exposure. Mount charts at eye level in study areas or slip smaller versions into binders for transport. Teachers initially utilize them as answer keys during early practice, gradually removing references as students achieve mastery. Tree Valley Academy recommends color-coding mastered facts to visualize progress, starting with the 1s, 2s, 5s, 10s, and 11s sequences before advancing to more complex tables.
Products in the 5s row alternate ending in 0 and 5, while the digits of any 9s product sum to 9 (for example, 9×7=63, and 6+3=9). These patterns reduce memorization load significantly.
Free Printable Times Table Charts (1-12)
Colorful Classroom Resources
Suncatcher Studio distributes high-resolution charts with customizable color schemes, including landscape orientations and diagonal emphasis for visual learners. These templates support high-quality printing up to 3000 pixels for large-format classroom displays.
Black-and-White Worksheets
Math Multiplication Tables offers filled, blank, and missing-numbers versions ideal for pencil-and-paper practice. The Scholastic blank grid supports formal assessment of student recall abilities.
Extended and Reference Charts
Inkpx distributes ranges from 1-9 through 1-20 for advanced learners requiring extended practice. The South Dakota Department of Education publishes a standard reference table showing products up to 12×12=144, suitable for state assessment preparation.
Customization and Creation Methods
Digital Tools and Formulas
Spreadsheet software enables rapid generation of custom charts. Input numbers 1-12 across the first row and column, then apply multiplication formulas to auto-populate products. Format cells with conditional coloring before exporting to PDF for classroom distribution.
Standard spreadsheet applications calculate products automatically when referencing row and column headers, allowing educators to generate custom color-coded grids without manual entry.
Physical Poster Creation
Print blank A4 templates from educational sites and have students complete cells manually. This handwriting process reinforces neural pathways through kinesthetic learning while producing personalized reference materials.
Enable “fit to page” margins when printing PDFs to ensure grid lines remain visible after trimming; high-resolution source files require appropriate printer settings to maintain clarity.
Historical Development of Multiplication Tables
- : Babylonian mathematicians utilized base-60 multiplication tablets, establishing early tabular calculation methods.
- : European textbooks formalized 1-12 tables, influenced by duodecimal systems governing time and commerce.
- : Common schools adopted wall-mounted charts as standard visual aids for arithmetic instruction.
- : Interactive digital applications emerged, offering automated generation and adaptive practice sheets.
Standards and Variations in Practice
| Established Standards | Variable Applications |
|---|---|
| 1-12 range standard for US/UK primary curricula | Some districts utilize 1-10 or 1-15 exclusively |
| 12×12=144 maximum product in basic competency | Extended charts to 20×20 vary by regional requirements |
| Grid format superior for pattern recognition | Digital versus physical format effectiveness debated among educators |
| Color aids visual learners objectively | Specific color schemes vary by publisher without standardization |
Cognitive Benefits and Global Standards
Multiplication charts serve as spatial scaffolds, displaying relationships that linear flashcards obscure. The grid format reveals doubling patterns, square numbers, and commutative properties simultaneously. Research indicates that visual pattern recognition accelerates fact retrieval more effectively than rote memorization alone, particularly for students in grades 2-4.
Global standards show remarkable consistency. The United States, United Kingdom, and Canada uniformly target 1-12 mastery by grade 3, though some districts extend requirements. This standardization parallels the PTE Score Chart approach, where clear benchmarks facilitate measurable progress across educational contexts.
Expert Perspectives on Visual Learning
Visual aids are essential for developing conceptual understanding before procedural fluency; multiplication charts provide the spatial reasoning foundation that isolated memorization cannot replicate.
National Council of Teachers of Mathematics
Daily chart practice recommended for ten minutes builds the automaticity needed for advanced arithmetic without anxiety.
Oxford Owl, Oxford University Press
Implementing Your Times Table Strategy
Select printable charts matching your learner’s visual preferences—colorful for engagement, black-and-white for focus. Position references within constant sightlines, transition to blank grids for assessment, and pair with the Heart Rate Zones Chart methodology of incremental goal-setting to track mastery milestones systematically.
Frequently Asked Questions
What age group benefits most from times table charts?
Children aged 7-10 in grades 2-4 show optimal benefit, though advanced younger students and remedial older learners also profit from visual reference tools.
Is there a difference between times tables and multiplication charts?
The terms are synonymous in educational contexts; both refer to tabular arrangements of multiplication facts, though “chart” often implies the visual grid format.
How do I print charts for classroom use?
Download PDFs from verified educational sources, select “fit to page” in print settings, and use high-resolution files for posters to ensure grid lines remain crisp.
Are extended charts beyond 1-12 necessary?
Charts extending to 1-15 or 1-20 serve as advanced supplements for grades 5-6 or enrichment programs, not as replacements for standard 1-12 mastery.
Can these charts help with division skills?
Yes, the same grid structure supports inverse operations; students locate the product and trace back to factors, reinforcing the relationship between multiplication and division.
Where can I find interactive digital versions?
Educational platforms offer digital charts with drill features, though specific interactive generators vary by provider and curriculum alignment.
More related posts
 TAFE Student Portal – Login Guide and Troubleshooting
 Centrelink Payment Increase October 2025 – Dates Rates and Schedule
 Ethan Hawke: Career, Relationships, and Verified Facts
 ASX Today Live Chart – Real-Time ASX 200 Updates
 AirPods Pro 3: Ireland Price, Review & Pro 2 Comparison
 Sydney Sweeney Soap: The Truth Behind the Bathwater Bar
 The Invisible Man 2020: Plot, Twist, Ending Explained
 Anti-Age Skin Care: Dermatologist-Approved Ingredients & Routines
